Free Download
UaExpert is available for Windows and Linux.
UaExpert—A Full-Featured OPC UA Client
The UaExpert® is a full-featured OPC UA Client demonstrating the capabilities of our C++ OPC UA Client SDK/Toolkit and OPC UA technology in general. The UaExpert is designed as a general purpose test client supporting OPC UA features like DataAccess, Alarms & Conditions, Historical Access and calling of UA Methods. The UaExpert is a cross-platform OPC UA test client programmed in C++. It uses the sophisticated GUI library QT form Nokia (formerly Trolltech). The basic framework of UaExpert is extendable by Plugins and will be improved over time.
The free version of UaExpert comes with following Plugins:
- OPC UA Data Access View
- OPC UA Alarms&Conditions View
- OPC UA Historical Trend View
- OPC UA Device Integration (DI) View
- Image Viewer
- Server Diagnostics View
- Simple Datalogger CSV Plugin
- OPC UA Performance Plugin
- GDS Push-Model Plugin
- XMLNodeSet-Export View (requires license)
- PubSub Config View (requires license)
The UaExpert is available for Windows and Linux. Since v1.7.0 The UaExpert is provided as 64bit edition for Windows (can not be used on WinXP anymore), we recommend using Windows 10 or higher. The Linux edition requires 64bit Linux (Intel x86/64 architecture).
UaExpert Common Framework
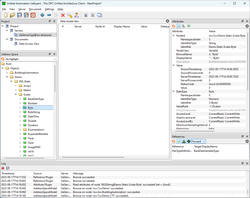
The basic framework of UaExpert includes general functionality like certificate handling, discovering UA Servers, connecting with UA Servers, browsing the information model, displaying attributes and references of particular UA Nodes.
The Project pane (upper left window) shows the connected UA Servers and the open document plugins. The Address Space pane (lower left window) shows the UA Servers information model. Depending on the Node selected in the Browser the Attribute and Reference Windows (upper right and lower right windows) show the attribute of the selected Node and its references within the meshed network of the servers address space.
OPC UA DataAccess View
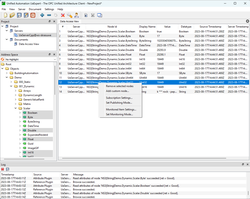
This plugin is shown in the center pane of UaExpert by default. You can (multi-) select UA Nodes in the Address Space window and drag-and-drop them into the DA View. The DA View cerates a subscription and monitors the Nodes. Sampling rate and subscription interval can be changed by right-click into the DA View.
When double-clicking into the Value column of a specific Node you can write new values to that Node, writing of scalar, array and matrix types is supported. The DA View was designed to show the classic view on OPC Servers solely concentrating on item monitoring and displaying values, timestamp and status of individual nodes.
OPC UA Alarms & Conditions View
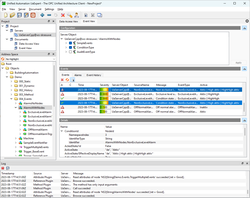
The Event View document can be added using the Add Document button in the menu bar. The Event plugin will be displayed in the center pane and consists of three major groups, the Configuration, the Event/Alarm view and the Details view showing the detailed information of an individually selected alarm.
You need to select a UA Node (this object must have the HasEvents attribute) in the Address Space browser an drag-and-drop it into the Configuration group of the Event View. Now you can select EventFields you are interested in for this eventing object, some fields are already configured by default (check boxes in the tree view). Whenever the object fires an event it will be displayed in the center group of the Event View. Here you can switch tabs beween Events and Alarm showing you the historical list of events or the current state of pending alarm. When clicking on an event the lower pane group will show you all the details of this particular event according to the selected event fields you ticked in the configuration.
OPC UA Historical Trend View
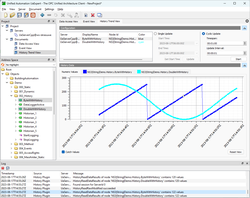
The Historical View document can be added using the Add Document button in the menu bar. The Historical plugin will be displayed in the center pane and consists of two major groups, the Configuration and the historical data view showing the values in a graphical trend view related to the requested time frame.
You need to select a UA Node (this object must have set the HistoryReadable flag of the (User)AccessLevel) in the Address Space browser an drag-and-drop it into the Configuration group of the Historical View. Here you can select the drawing color, especially when you add several Nodes to the list. TheHistorical Trend View supports two modes for fetching the data from the UA Server, the Single Update and the Cyclic Update.
For Single Update you need to specify the time frame, defined by start and end date/time and the UaExpert will perform an historical read raw when pressing the Update button. In the Cyclic Update mode you must specify the time span (backwards from now) and the interval the UaExpert should fetch new data. When pressing the Start button the UaExpert will cyclic (interval) perform an historical read raw using now as end time and now-timespan and end time. This will give a typical chart recorder use case.
OPC UA Performance View
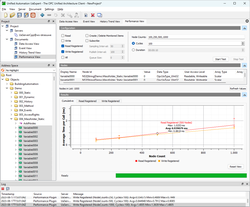
The Performance View document can be added using the Add Document button in the menu bar. The performance plugin will be displayed in the center pane and consists of three major groups, the Configuration, the list of used nodes and the results showing the measurement in a graphical view.
First you need to select the UA Nodes that should be used for testing (they all must have proper accessrights for write tests and they should move - automonously change data - for subscription tests). You can (multi-) select the nodes in the AddressSpace browser and drag-and-drop them into the centerlist of nodes. All nodes must be from the same UA Server and should have the same data type for easier interpretation of the results. Now the performance measurement must be configured, you need to select the UA services you want to measure and you must configure the number of nodes used for the set of measurements. The number of cycles gives you the number of calls performed for each measurement (high number will give acurate average measurement, but may take long time). The UaExpert will call the UA Service and measure the duration of each call. Alternatively you can choose the Duration option instead. Here the UaExpert will call the UA service as fast as possible in that time span and count how many calls could be performed (this option should be used on very fast operation to give an accurate result).
The results will be displayed in the lower graphical pane. The cumulative graphic shows the comparison between different UA services (comparing calculated average values). In addition every individual UA service measurement is displayed separately to validate constancy and trustability of the measurement.
OPC UA Image Viewer
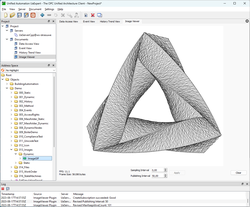
The Image View document can be added using the Add Document button in the menu bar. The image viewer plugin will be displayed in the center pane and can show the image in the center pane, but also allows to subscribe for an image that changes (which is a movie).
First you need to select the UA Nodes that is a picture (static) or movie (dynamic). Our UA Demoservers have some pictures for testing in the address space. With configuring the subscription parameters (sampling interval and publish interval) you can probe the effects of smooth operations. The plugin will show the frames per second (FPS) and the frame size (data value of the node), which is an indication how fast the server can deliver data (dynamic pictures).
Simple Data Logger CSV
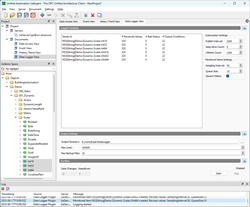
The Data Logger View can be added using the Add Document button in the menu bar. The data logger plugin will be displayed in the center pane and consists of three major groups, the Logged Variables, which is the list of nodes being logged including the subscription and Items settings, and the Output File configuration. When being startet the logger sshos Runtime status (number of received Data Changes.
First you need to select the UA Nodes that should be used for loggin (they all must have proper accessrights for read access AND they must have simple scalar data type for being logged easily). The purpose of this data logger plugin is to demonstrate the technology features built-in OPC UA. By modifying Subscription and Monitored Item settings, and by configuring the Value-Queue, you will learn how powerful and effective a smart configuration of these parameters may help you to catch and record values with low transmission rate.
The Data Logger is for demonstration only, the maximum speed of recording is limited by the hard drive write rate, the comma separated (CSV) file format is fixed and optimized for reduced storrage (e.g. storing NodeID by index). However, the maximum number of nodes to be logged was tested with 10-20 depending on the value size.
OPC UA XML Export (NodeSet2)
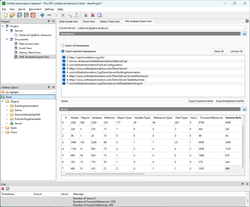
The XML Nodeset Export View document can be added using the Add Document button in the menu bar. The XML Export plugin will be displayed in the center pane and consists of two major groups, the Namespace selection, the list of namespaces to be exported, and secondly the results, which is a statistic of node counts that have been found and exported.
First you need to select the Namespaces that should be exported. The XML Export plugin will recursively browse through the entire address space (all namespaces) and save the findings in an XML file in standardized NodeSet2 format. The Plugin can create one file per each namespace or export multiple namespaces into one single file.
When selecting namespaces for export, make sure you also export dependencies, some nodes may reference types from previous namespaces. With this plugin you can "copy" the address space (types and instances) of a connected UA Server and store in XML File. This file can be used e.g. for "offline" configuration of HMI systems or UA Clients, or yopu can program (specialize) your UA Client implementation against the copied types using UaModeler's code generators. When importing again into UaModeler or UaDemoServer make sure you have the correct order.
The XML Nodeset Export requires a license key when exporting more than 20 nodes in total. Contact sales(at)unified-automation.com for details.
OPC UA PublishSubscribe Configuration
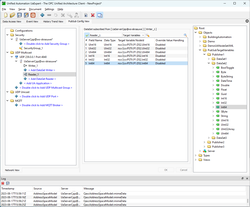
The PubSub Config View document can be added using the Add Document button in the menu bar. The PubSub Config plugin will be displayed in the center pane and consists of two major groups, the Network View, a tree of configuration objects organized in the network topology of the devices and secondly the details thereof depending on the selceted tree entry.
The PubSub Congig Plugin allows multiple configuration for multiple pubsub transports. From a network vviewpoint you add devices which can be Writer (publisher) or Reader (subscriber) or both. One device can have multiple Writers with multiple DataSets. The DataSet can be configured and connected to SourceNodes (writer) or TargetNodes (reader) respectively. With that you create Device to Device communication including the mirroring of your PubSub Flields on OPC UA Variables. The PubSub configuration can be downloaded directly into the connected UA Servers, or stored into file (standardized OPC UA binary format), in case your device is not connected or not capable of download.
The PubSub Config Plugin requires a license key when exporting more than 2 Reader/Write pairs in total. Contact sales(at)unified-automation.com for details.

